


The Importance of Diversification in Investing
Investing in stocks can be a complex and challenging task that requires careful consideration of many factors, a major one being risk exposure. There are two main types of risk exposure that investors must be aware of. The first is called systematic or market risk, which is inherent to all companies and cannot be avoided. This type of risk is caused by factors such as interest rates, inflation, political turmoil, war, and exchange rates and affects all investors equally.
The second type of risk is known as diversifiable or unsystematic risk, which is specific to a particular company, market, industry, economy, or country. Business and financial risks are common examples of unsystematic risks. However, this risk can be reduced through diversification by investing in a variety of assets so that not all are affected in the same way by market events. But what is portfolio diversification exactly?
Portfolio diversification is the practice of spreading investments across different asset classes, sectors, and geographic locations to reduce risk and increase returns. The idea is that a diversified portfolio will perform better in different market conditions than a portfolio that is heavily invested in a single asset class. This is because if one investment performs poorly, the others may perform well and offset the losses.
Ray Dalio, the legendary investor and founder of the world’s largest hedge fund, Bridgewater Associates, called diversification the “Holy Grail of Investing” for good reasons.
First, it helps to reduce the risk of large losses from a single investment. When investments are spread out, there is less risk of losing a significant portion of the portfolio value if one investment performs poorly. Second, diversification can help to balance a portfolio so that it is less sensitive to market fluctuations. This makes it easier for investors to ride out market ups and downs without having to make sudden, panicked decisions about their investments.
Another reason why portfolio diversification is important is that it can help investors achieve better returns over the long term. A well-diversified portfolio is more likely to benefit from the growth potential of different investments and to generate consistent returns over time. By spreading investments across different asset classes, investors can reduce the impact of short-term market volatility and focus on the long-term potential of their investments.
This is why the principle of diversification lies at the heart of every investment strategy. This is the key premise and objective of portfolio building.
Maximizing Returns and Minimizing Risk: The Power of Portfolio Optimization
In the 1950s, when Harry Markowitz, a Nobel Prize-winning economist, published his paper on portfolio selection the concept of Portfolio Optimization arose. Portfolio Optimization is the process of selecting the optimal portfolio based on investment goals, risk tolerance, and market conditions. It involves making decisions about which investments to include in a portfolio, and how much of each investment to include, in order to achieve the desired risk-return balance. By focusing on diversification and portfolio optimization, investors can increase their chances of achieving their investment goals and minimize the risk of large losses. This is why conventional wisdom says somebody can achieve optimal portfolio diversification with 15 to 20 stocks spread across various industries, asset classes, and geographies.
The increasing popularity of portfolio optimization tools has made it easier for investors to create balanced portfolios that meet their investment goals. These tools use complex mathematical models and algorithms to analyze market conditions and provide recommendations on which investments to include in a portfolio, and how much of each investment to include. The tools use various inputs, such as past performance, volatility, and risk levels, to determine the best combination of investments for a particular portfolio.
However, while portfolio optimization tools have become increasingly popular, they have also earned a reputation for being “black boxes.” This is because the decision-making processes behind these tools are based on complex mathematical models and algorithms that are not always transparent or understandable to the average investor. Some investors may not have the expertise or understanding to interpret the results and recommendations provided by these tools.
Shortcomings of Portfolio Optimizers
Recent advances in Information technology have allowed the emergence of commercial tools for portfolio diversification. Platforms like the Bloomberg Terminal, and Refinitiv Eikon offer their own tools for portfolio selection in order to help manage risk. Most of these tools use algorithms based on Modern Portfolio Theory pioneered by Harry Markowitz. However, the inputs, assumptions, and decision-making processes involved in these models can be difficult to understand, leaving most users feeling in the dark about the reliability and suitability of the results. This is a major concern for investors who want to have full control over their investments and make informed decisions based on accurate information. To make matters worse, some portfolio optimizers use proprietary methods that are not publicly disclosed, which adds another layer of uncertainty to their results.
This is where network visualization comes in as a valuable tool to complement the standard portfolio optimization process. By visualizing the relationships between stocks, investors can get a clear and concise picture of the industries, sectors, and market trends that influence their investments. Furthermore, network visualization can provide a more transparent view of the decision-making process, helping investors to understand the logic behind the recommendations and make more informed decisions.
The network visualization can also help to identify the companies that are direct competitors or complementary to each other, which is useful information for investors when trying to diversify their portfolios and mitigate risk. Additionally, the network visualization can help to identify outliers, which are stocks that do not fit in with the general trend of the market. These stocks can be overpriced or underpriced, and by identifying them, investors can make informed decisions about their investments.
By incorporating network visualization into the portfolio optimization process, investors can get a clearer and more transparent picture of the relationships between stocks and make informed decisions based on accurate information. However, it is important to keep in mind that the insights provided by network visualization are based on the correlation between stocks and other factors such as market trends, company-specific events, and government regulations can also affect stock prices.
Comparing Correlation Matrices and Network Visualizations
Often used visualization techniques to help understand the correlation between a group of stocks are the correlation matrices, seen below…
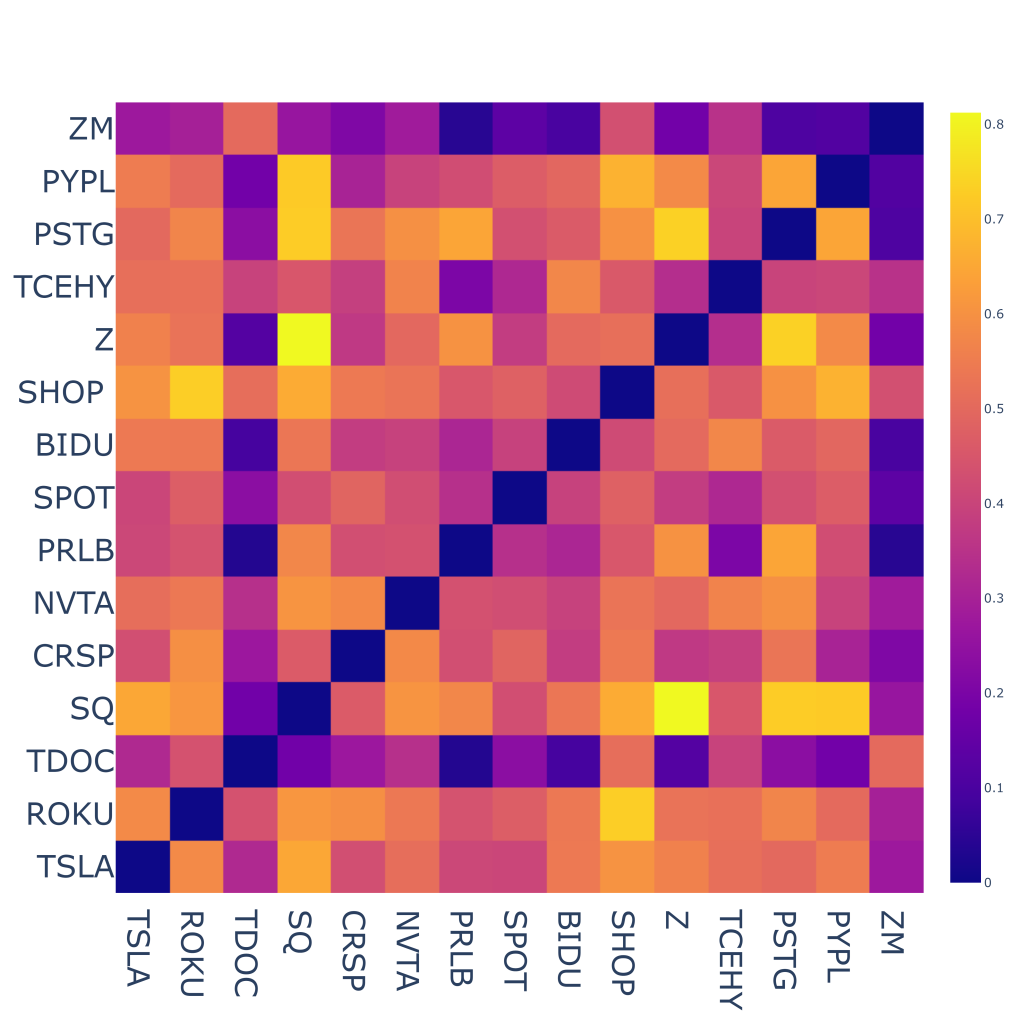
When comparing Correlation Matrices and Network of Correlations Visualization, it’s important to consider the type of information each method provides and the ease of interpretation. Correlation Matrices give a basic understanding of the strength and direction of relationships between variables, but this information is limited. On the other hand, Network of Correlations Visualization offers a much more comprehensive view of relationships, including clusters and patterns, which can give a deeper insight into the relationships between variables.
Another limitation of Correlation Matrices is that they only measure linear relationships, whereas Network Visualization can reveal non-linear relationships as well. Additionally, Correlation Matrices do not differentiate between direct and indirect relationships, whereas Network Visualization clearly illustrates direct relationships and identifies indirect relationships through paths in the network. When it comes to interpretation, Correlation Matrices can become complicated for larger datasets, whereas Network Visualization presents the relationships in a clear and concise manner. Finally, while Correlation Matrices provide information in the form of a table of numbers, Network Visualization offers a visual representation that can be customized to suit the user’s needs.
| Comparison Criteria | Correlation Matrices | Network Visualization |
| Information Provided | Strength and direction of relationships | Comprehensive view of relationships, including clusters and patterns |
| Detection of Non-linear Relationships | Limited | Reveals non-linear relationships |
| Differentiation between Direct and Indirect Relationships | No differentiation | Clearly shows direct relationships and highlights indirect relationships |
| Interpretation | Difficult for large datasets | Clear and concise representation for datasets of any size |
| Visualization Options | Table of numbers | Customizable visual representation |